
Utility Statistics
Leading the way for energy sustainability
For more than a century, MSU has provided energy for itself with the innovative power and heat generation technology of the time, and we plan to keep doing that into the next century.
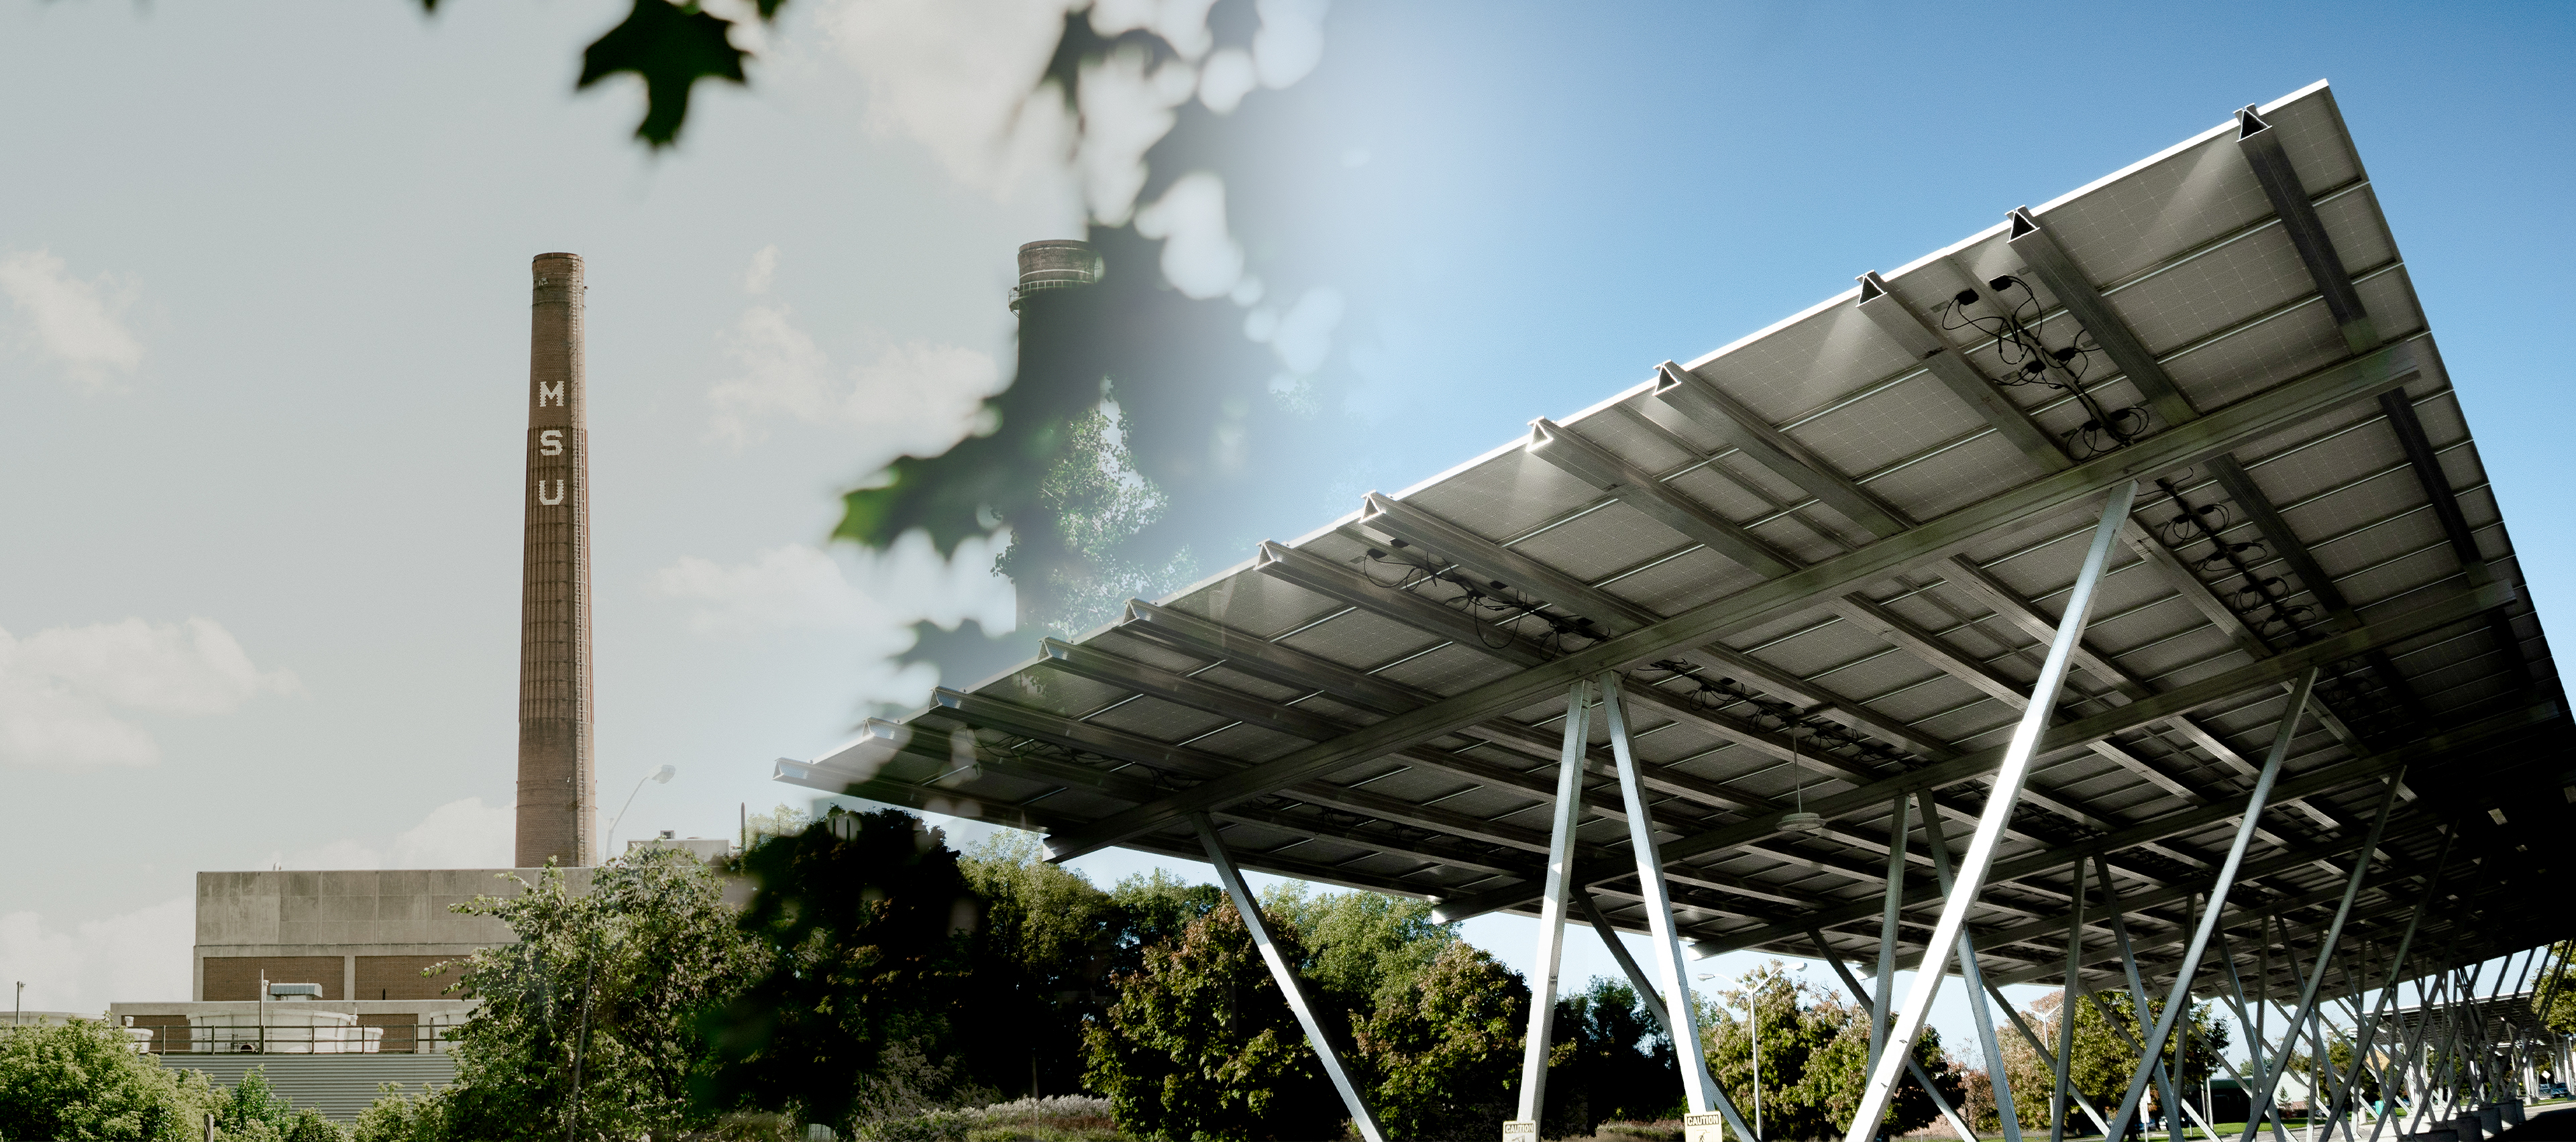
To power MSU's mission of advancing knowledge and transforming lives, IPF operates the T.B. Simon Power Plant and receives power from solar arrays covering 45 acres of parking lots, the largest of its kind in North America. In 2019, MSU started work on adding new, highly efficient engines to not only generate electricity but also better take advantage of campus' carport solar arrays to further reduce MSU's greenhouse gas emissions.
Dependable. Affordable. Sustainable. That's our commitment to power generation on campus and a big part of the reason why MSU was named a top 20 university for sustainability and the only Big Ten institution appearing the top 50.
Please review key metrics about electrical and steam production below.
Basics about the T.B. Simon Power Plant
First powered on in 1966, MSU's power plant delivers reliable and affordable electricity and steam for campus, powering the university's ability to advance knowledge and transform lives.
Assisted by the solar arrays and an anaerobic digester, the electricity from the plant powers everything from your laptop to the nuclear research done at the Facility for Rare Isotope Beams. And the plant's steam heats most campus buildings during cold months and cools them during the warm ones.
Curious about where MSU gets its water or why red-water events occur?
Take a look with this video to find out where campus water comes from and what we're doing to lessen red-water events in the future with MSU's new water treatment facility that will remove iron and other minerals from campus water to improve its taste and appearance.
Once online, the plant will start removing iron and other minerals, but it will take time to see noticeable improvement with some buildings seeing changes sooner than others.
Utility Production and Consumption
Electricity |
2016-2017 |
2017-2018 |
2018-2019 |
| Fuel Consumed (Trillions of BTUs) | 6.13 | 6.28 | 6.68 |
| Campus Steam (1,000 lbs) | 1,984,000 | 2,111,000 | 2,124,847 |
| Campus Electrical Demand (MWh) | 295,986 | 315,056 | 331,280 |
| Plant Generation (Gross MWh) | 309,462 | 315,516 | 334,173 |
| Plant Generation (Net MWh) | 257,374 | 261,968 | 281,208 |
| Electrical Tie Line Purchase (MWh) | 42,286 | 48,951 | 41,795 |
| Electrical Tie Line Sold (MWh) | 3,598 | 3,344 | 4,813 |
| Carport Solar Purchase (MWh) | 0 | 7,542 | 13,181 |
| Carport Solar Sold (MWh) | 0 | 60 | 91 |
Water |
2016-2017 |
2017-2018 |
2018-2019 |
| Reservoir (1,000 gallons) | 1,053,399 | 1,202,437 | 1,170,623 |
| Well Field (1,000 gallons) | 1,226,150 | 1,287,541 | 1,233,935 |
Utility Production Capacity
Boilers |
Steam (Klbs./hour) |
Electricity (MW) |
| Unit 1 | 250 | 12.5 |
| Unit 2 | 250 | 12.5 |
| Unit 3 | 350 | 15 |
| Unit 4 | 350 | 21 |
| Unit 5 | N/A | 24 |
| Unit 6 | 115 | 13.5 |
Total |
1,315 |
98.5 |
| CPCO Tie Line | N/A | 100 |
Water System |
2017-2018 |
2018-2019 |
| # of Wells | 15 | 15 |
| Nominal Well Capacity (GPM) | 7,700 | 8,248 |
| Reservoir Storage Cap (Gallons) | 1 million | 1 million |
| Reservoir Pump Cap (GPM) | 9,600 | 9,600 |
Utility System Peak Demands
| 2017-2018 | 2018-2019 | |
| Electrical System (MW) | 72.1 | 74.3 |
| Campus Steam (1,000 lbs./hour) | 516 | 552 |
| Water (GPM) | 5,000 | 5,500 |
Utility Emissions
| CY 2017 | CY 2018 | |
| NOx (tons) | 315 | 342 |